Map figure 1: Explore the Cesium Ion slideshow via the above controls (CTRL or ⌘ + click to rotate).

Visualizing point clouds and their derivatives

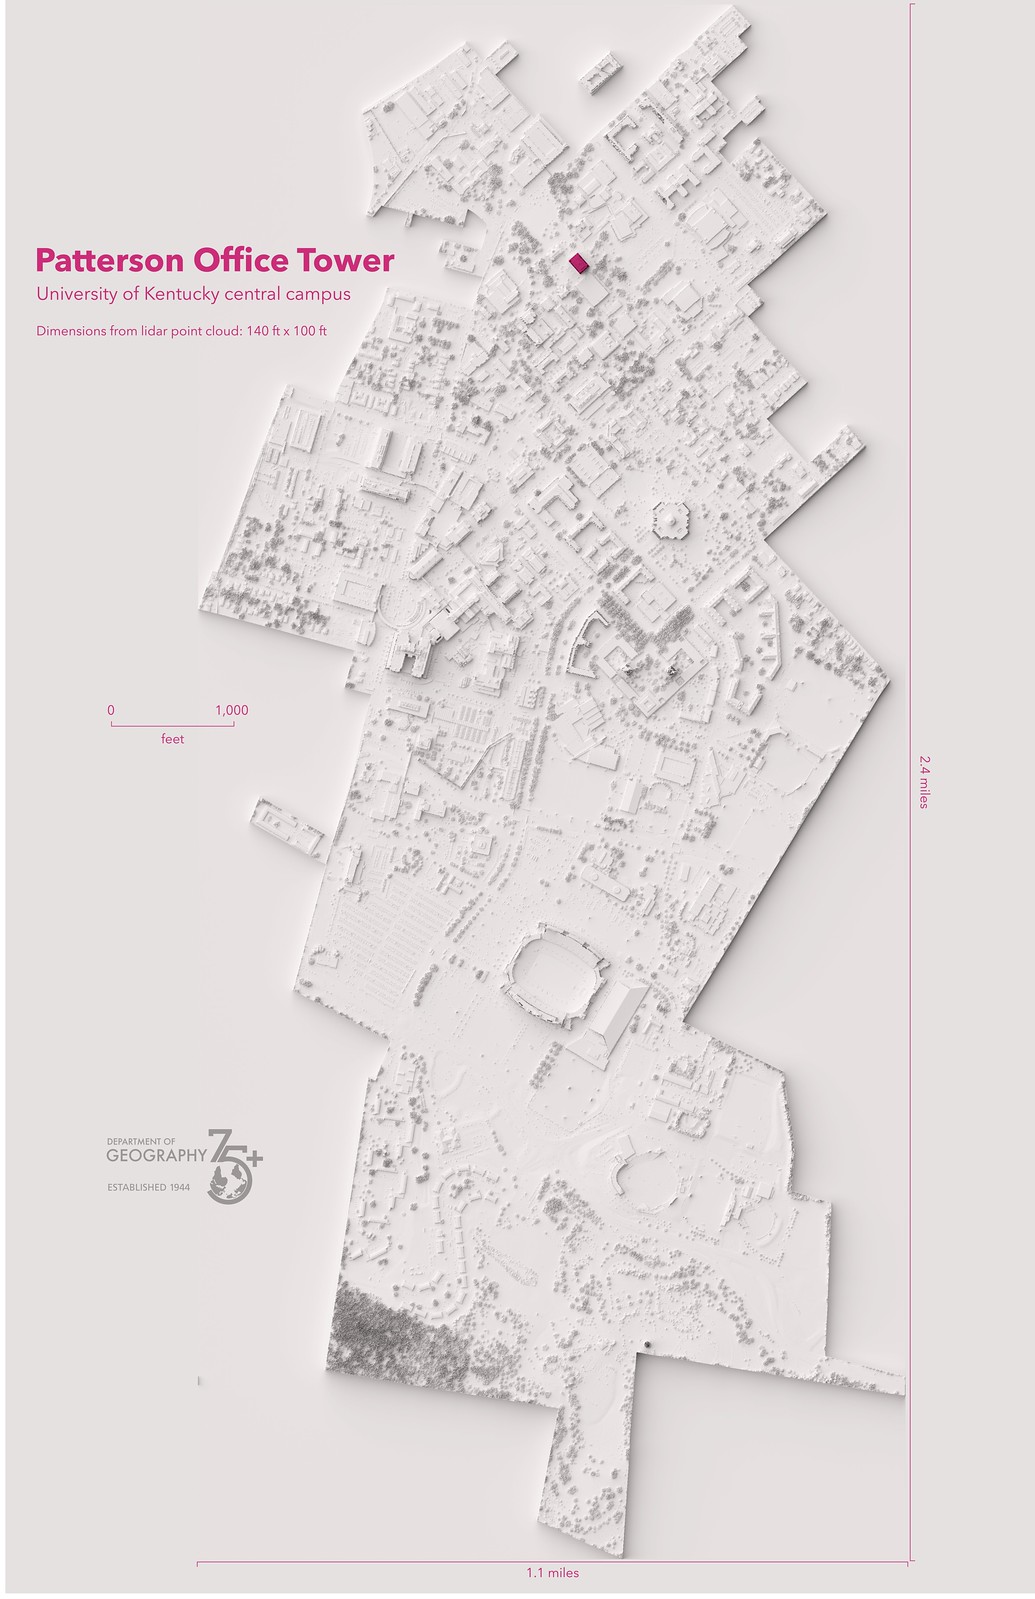
University of Kentucky's central campus

Visualizing lidar point clouds typically involves colorizing a cloud with aerial imagery taken near the same time as the lidar scan. The Cesium Ion slideshow above shows a 2019 point cloud (using 2018 NAIP imagery) for UKy's central campus.

However, campus also has a point cloud from 2010. Creating digital surface models (DSM) of these point clouds allows comparison in heights between the two years, e.g., changes in building and tree heights. To find the difference in height, the calculation subtracts the 2010 DSM from the 2019 DSM. The resulting raster layer is multiplied over a shaded relief base map from the 2019 DSM in Map figure 2.

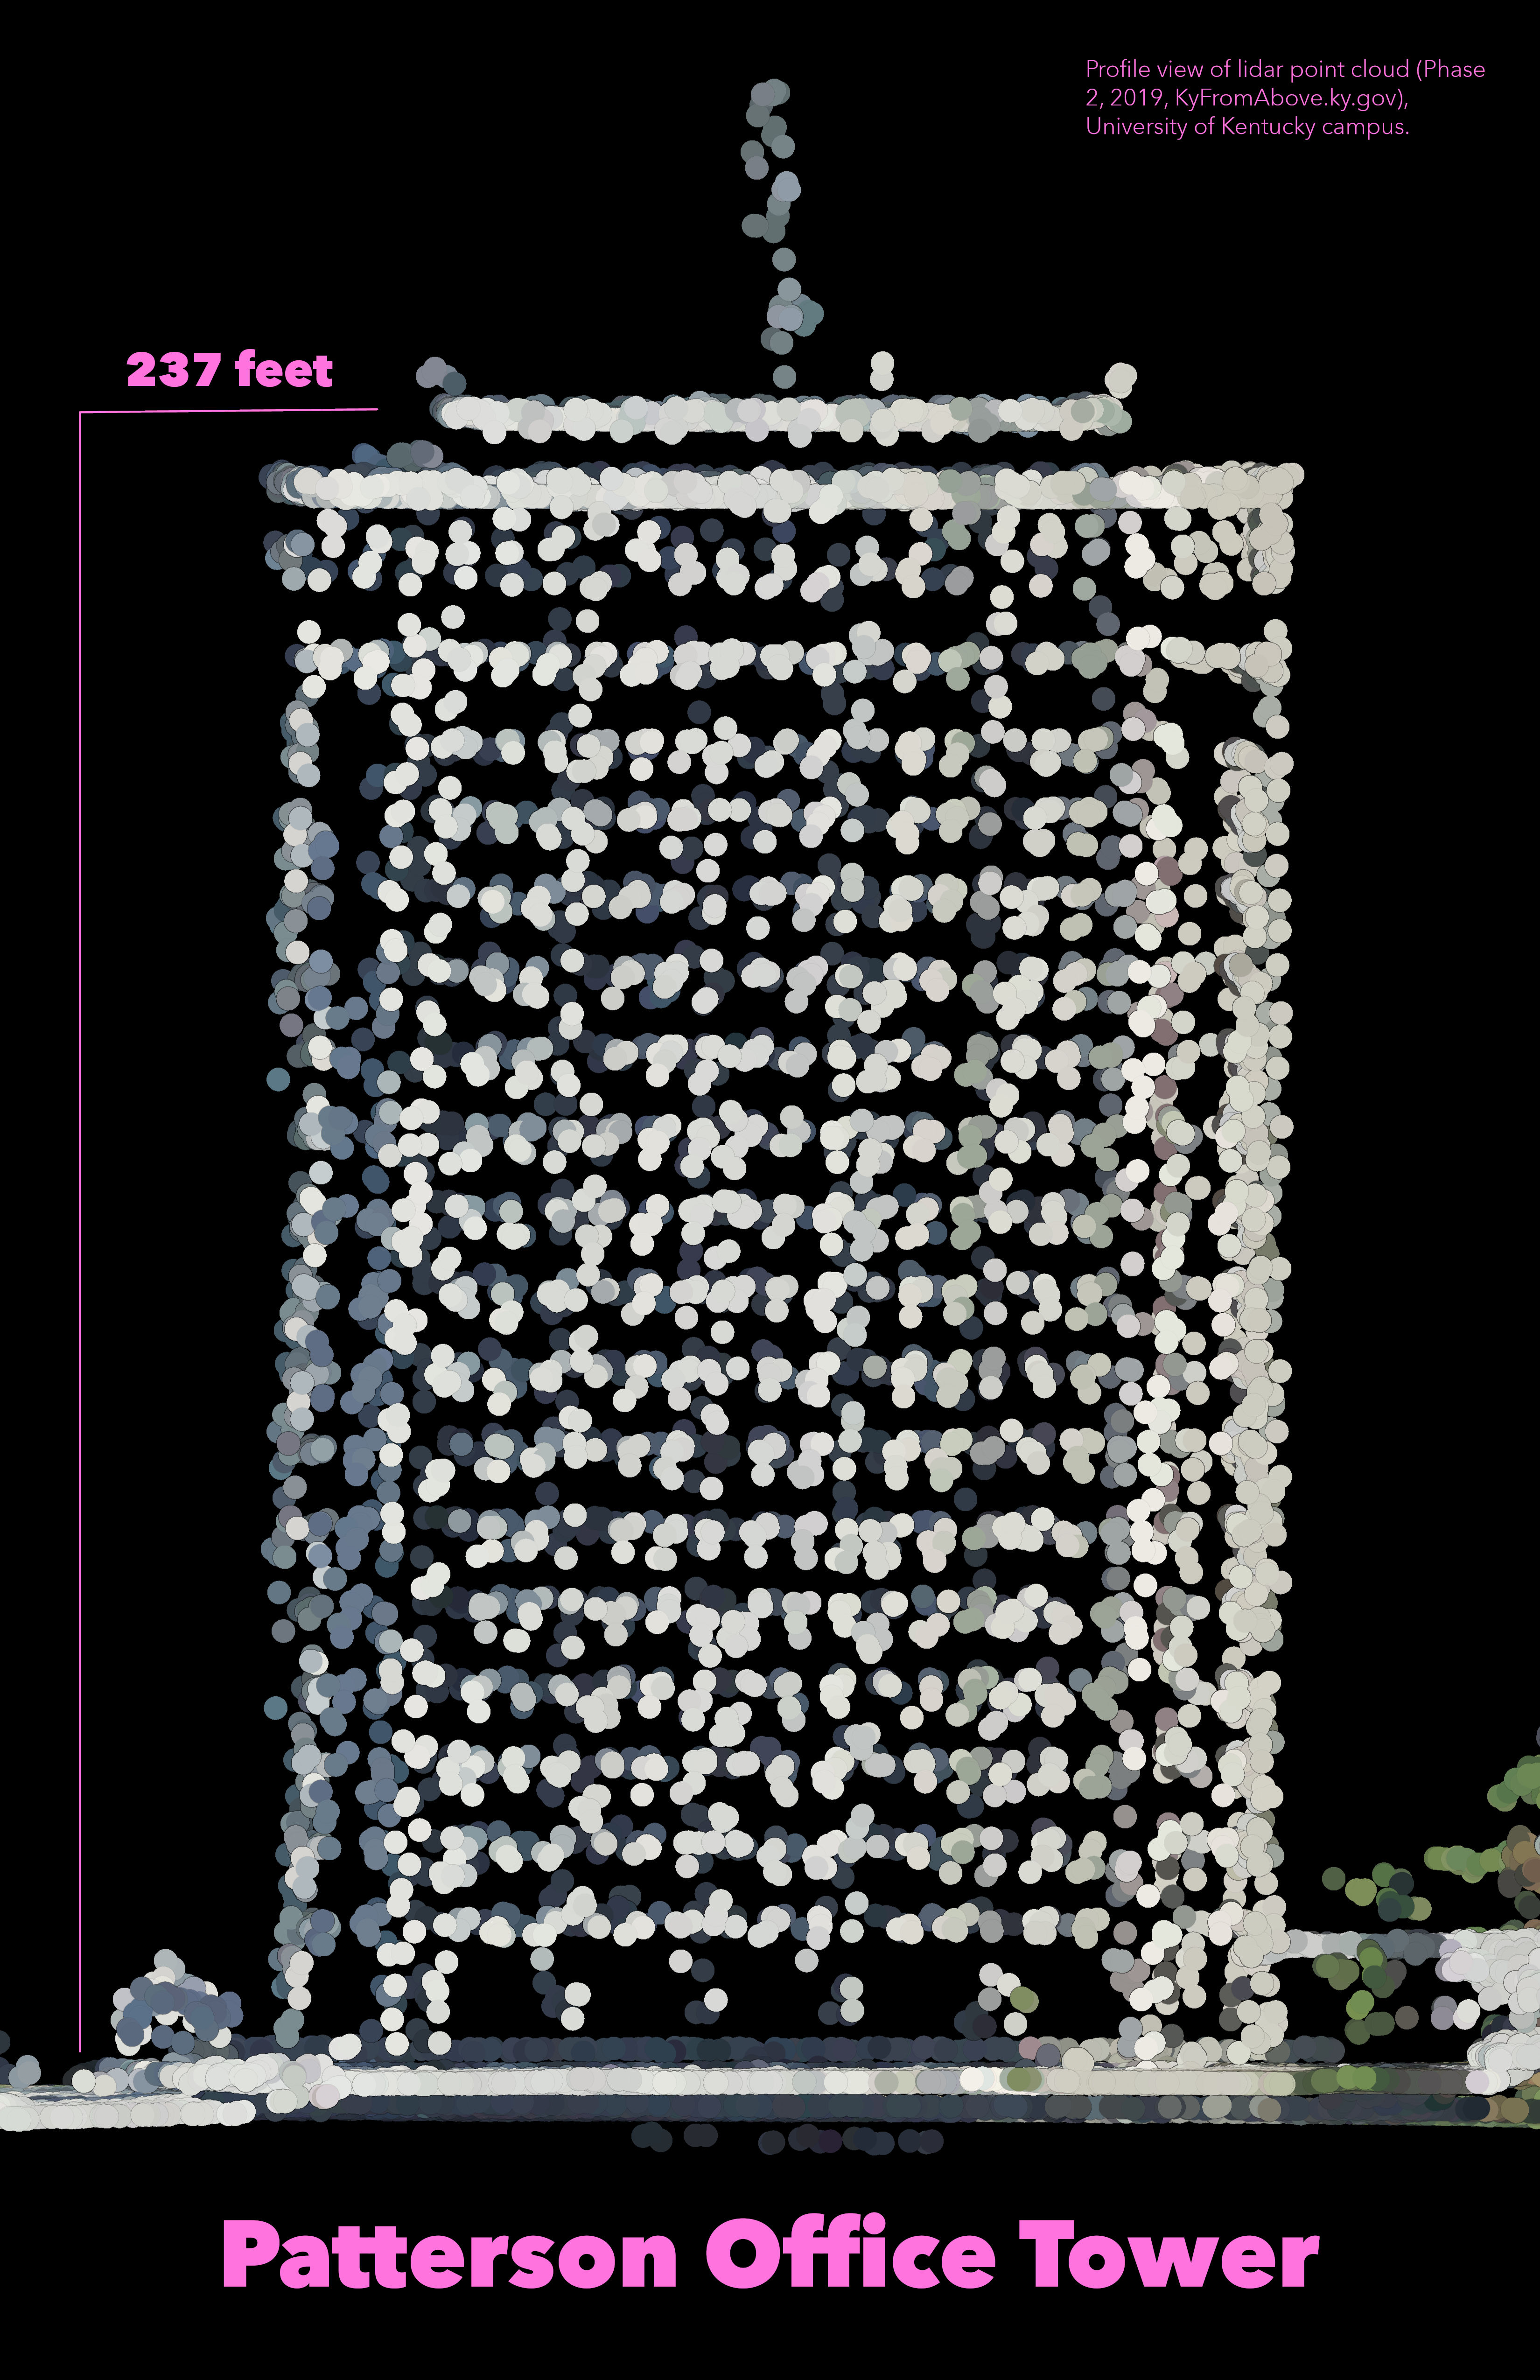
Lidar point clouds are valued for their high resolution and accuracy in capturing both ground and above-ground features. Aerial lidar scans often capture the sides of buildings that are not shown in aerial imagery. Patterson Office Tower (POT) is a good example of this. The 2019 point cloud shows the sides of POT – with enough detail that we can create an elevation profile and finally ask, "If we put the phrase 'Geography Y'all' in Geography department windows, who will see it?"

The below section explores this question. We have discovered that the 8th floor of POT (Geography's home) is close to 1,075 feet above sea level. Using a viewshed analysis with a DSM created from the 2019 point cloud, we can visualization where these windows are visible from neighboring locations on the ground.

Visualizing change

Campus change, 2010-2019

Map figure 2: Changes in campus surface heights. Enlarge

Visualizing Patterson Office Tower: It's Geography Y'all!

Figure 3: POT elevation profile, all aspects. Zoom and pan to view individual offices.

Location on campus

Patterson Office Tower

Map figure 4: Location of Patterson Office Tower (POT) Enlarge

POT elevation profile SE aspect

The Patterson Office Tower is the second tallest building on campus after the Albert B. Chandler Hospital. It stands approximately 240 feet with a base of 140 by 100 feet. Most of the Department of Geography's offices are on the 8th floor with a few teaching assistant offices located on the 14th floor. The elevators have a twitter handle: @PotElevators.

Map figure 5: POT SW aspect elevation profile. Enlarge

Who can see the 8th floor?

Viewshed analysis of Patterson Office Tower

Map figure 6: Viewshed analysis using DSM to locate where ground observers can see the 8th floor NW and SE aspects. Enlarge

Sources & Methodology

Two data sources were used in the production of these visualizations:
1. KyFromAbove Phase 1 and 2 lidar point clouds
2. 2018 NAIP imagery acquired from kyraster.ky.gov

Page and visualizations created by Boyd Shearer, April, 2023. for GEO 409, Department of Geography, University of Kentucky. Spring 2023.

The point clouds were extracted with LASTools and assembled and colorized in ArcGIS Pro. Digital surface models were created in ArcGIS Pro for the 2010 and 2019 point clouds. The height change model was created by subtracting the 2010 DSM from the 2019 DSM using Map Algebra. The shaded relief base map was created in Blender from the 2019 DSM. The elevation profiles were created QGIS and exported to Adobe Illustrator. The viewshed analysis was created in ArcGIS Pro and exported as a GeoTIFF.