Zoom in to change layers and hover over points for more inoformation.
Bicyclist versus car collisions
Collision locations and demographics for collisions in Kentucky 1/1/2004 - 9/12/2016.
Summary statistics
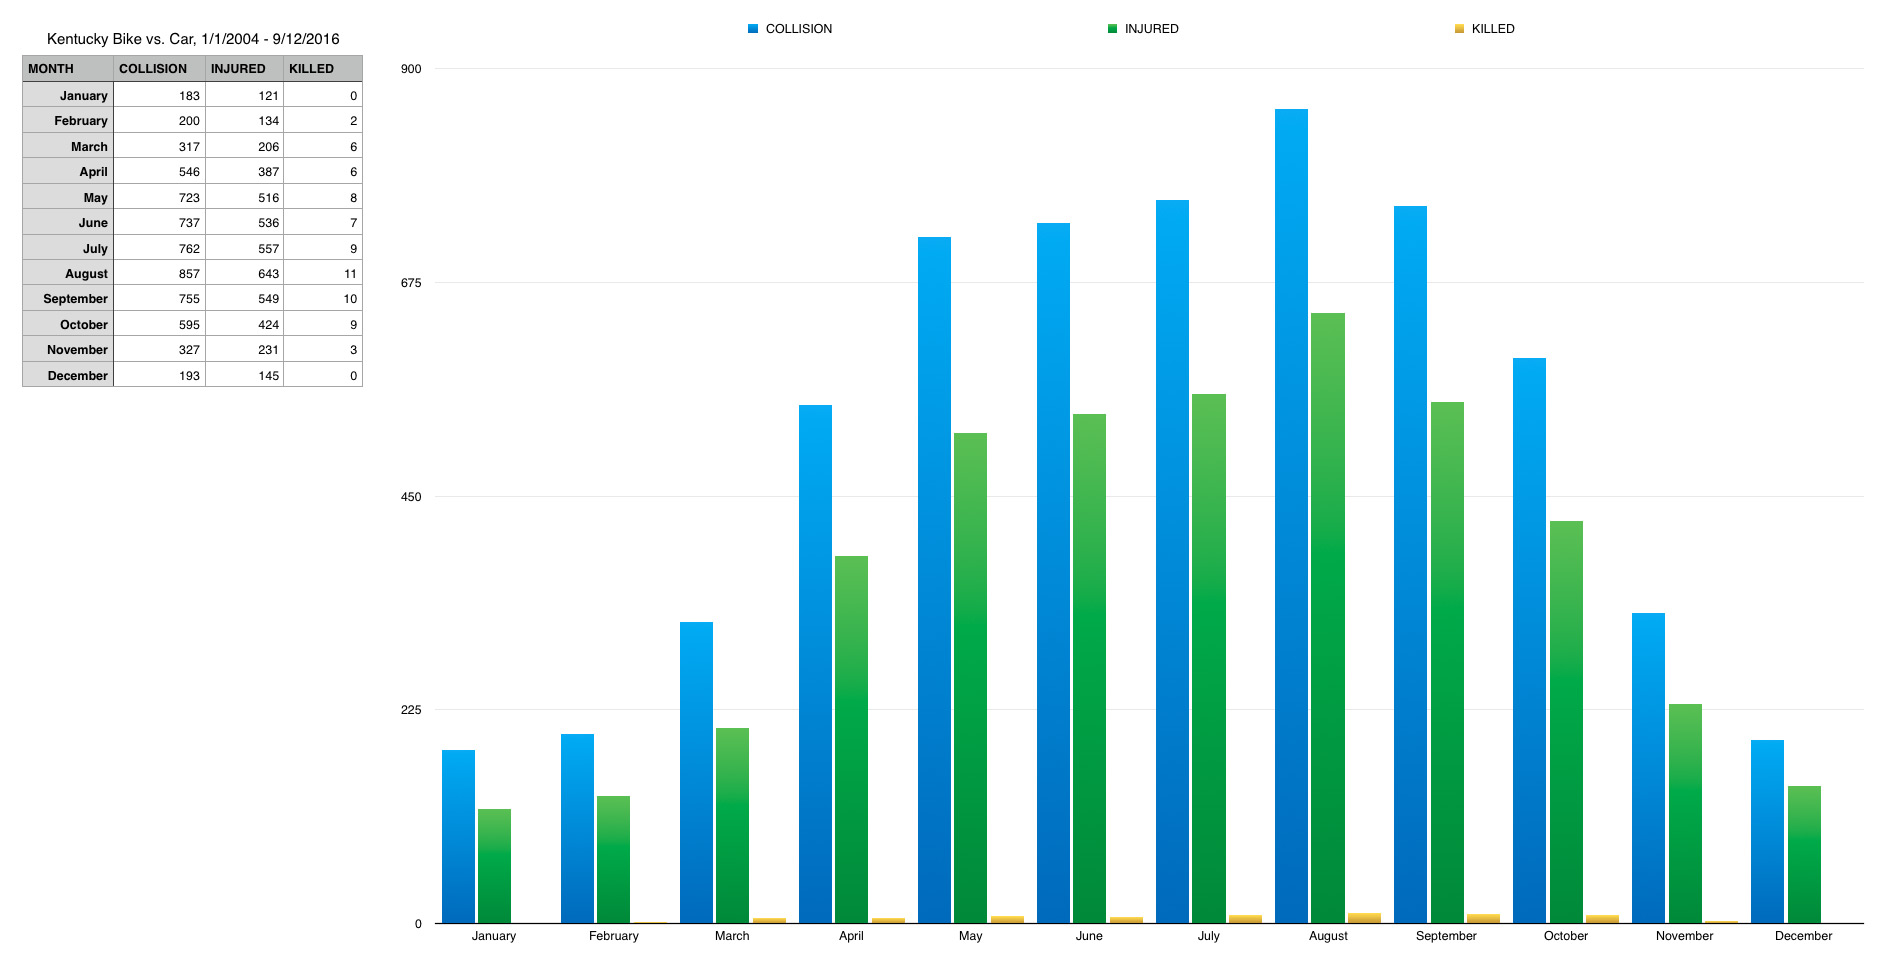
- Collisions: 6,196
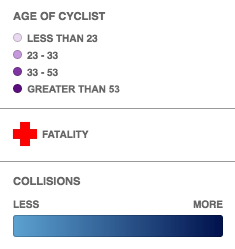
- Average age of cyclist: 27.7 years old
- Helmet: 15% wear helmets
- Time of day: 3:35pm
- Hit and Run: 16% with 980 cases
- Injuries: 75% with 4,625 injuries
- Fatalities: 1.3% with 79 fatalities
- By Gender
- Female: 1090 collisions, 11 fatalities (1.0%), 877 injuries (81%), 24.7 average age, 12% hit and run, 19% with helmets
- Male: 5047 collisions, 68 fatalities (1.3%), 3726 injuries (74%), 28.3 average age, 15% hit and run, 15% with helmets
Data from Kentucky Crash Analsysis Wizard: crashinformationky.org
Map Legend
News accounts of fatalities
April 17, 2016August 28, 2015
April 8, 2013
August 30, 2012
October 24, 2012
Novermber 11, 2006
Bar chart of collisions
by month
Home: Pedestrian and bike collisions
Contact: Boyd Shearer, instructor
GEO 409: Advanced GIS. University of Kentucky Department of Geography, September 2016.
GEO 409: Advanced GIS. University of Kentucky Department of Geography, September 2016.