Wildfire locations summarized by county polygons. Zoom in to identify individual fires. Full map
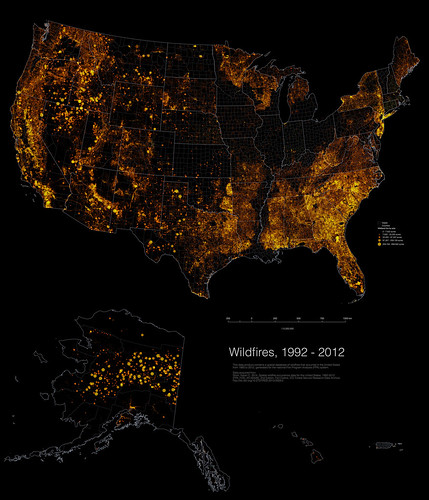
U.S. Wildfires
An analysis of wildfire activity as reported by the national Fire Program Analysis (FPA) system
Wildfire by fire size, 1992-2012
Methodology
This project was a demonstration of capability using large datasets and free and open source mapping software. This project used QGIS, PostGIS, and CARTO to make the maps and visualizations on this page. Over 1.5 million fire point locations were converted to SpatiaLite database and then classified and styled in QGIS. The map was exported as a tiff format and published on Flickr. Fire acreage by county (1992-2013) was calculated on an instance of PostgreSQL with the PostGIS extension. The functions ST_Intersects and SUM and GROUP BY were used to add the amount of acres burned in each polygon. Finally, this polygon layer and a subset of fire locations were styled, given interactivity, and animated in CARTO.
Data Source
Spatial wildfire occurrence data for the United States, Karen C. Short
Short, Karen C. 2015. Spatial wildfire occurrence data for the United States, 1992-2013 [FPA_FOD_20150323]. 3rd Edition. Fort Collins, CO: Forest Service Research Data Archive. http://dx.doi.org/10.2737/RDS-2013-0009.3
This data product contains a spatial database of wildfires that occurred in the United States from 1992 to 2013, generated by the national Fire Program Analysis (FPA) system. The wildfire records were acquired from the reporting systems of federal, state, and local fire organizations. The following core data elements were required for records to be included in this data product: discovery date, final fire size, and a point location at least as precise as Public Land Survey System (PLSS) section (1-square mile grid).